
Extended References
On this page more details on the papers that are utilized is presented.
Inferring gender from names on the web: A comparative evaluation of gender detection methods.Karimi, Fariba, et al. Proceedings of the 25th International Conference Companion on World Wide Web. International World Wide Web Conferences Steering Committee, 2016. Check github repository |
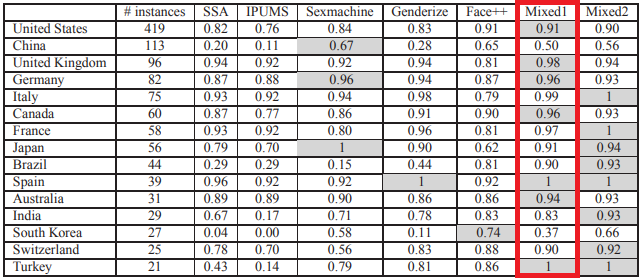
Karimi et al. [1] compare existing gender inference tools and investigate their biases towards certain sub-populations. They suggest a novel method of augmenting name-based methods with image retrieval and recognition (what we call on this website a mixed approach).They show that such a method reduces biases towards names from certain countries and improves general performance.
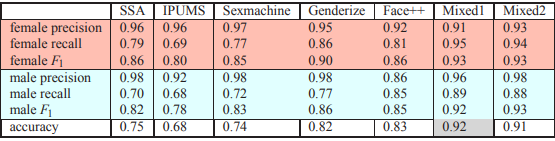
The accuracy of mixed approaches in comparison with other various tools is shown in the table below. It can be seen that for the majority of countries mixed perform best.
Comparison and benchmark of name-to-gender inference services.Santamaría, Lucía, and Helena Mihaljević. PeerJ Computer Science 4 (2018): e156. |
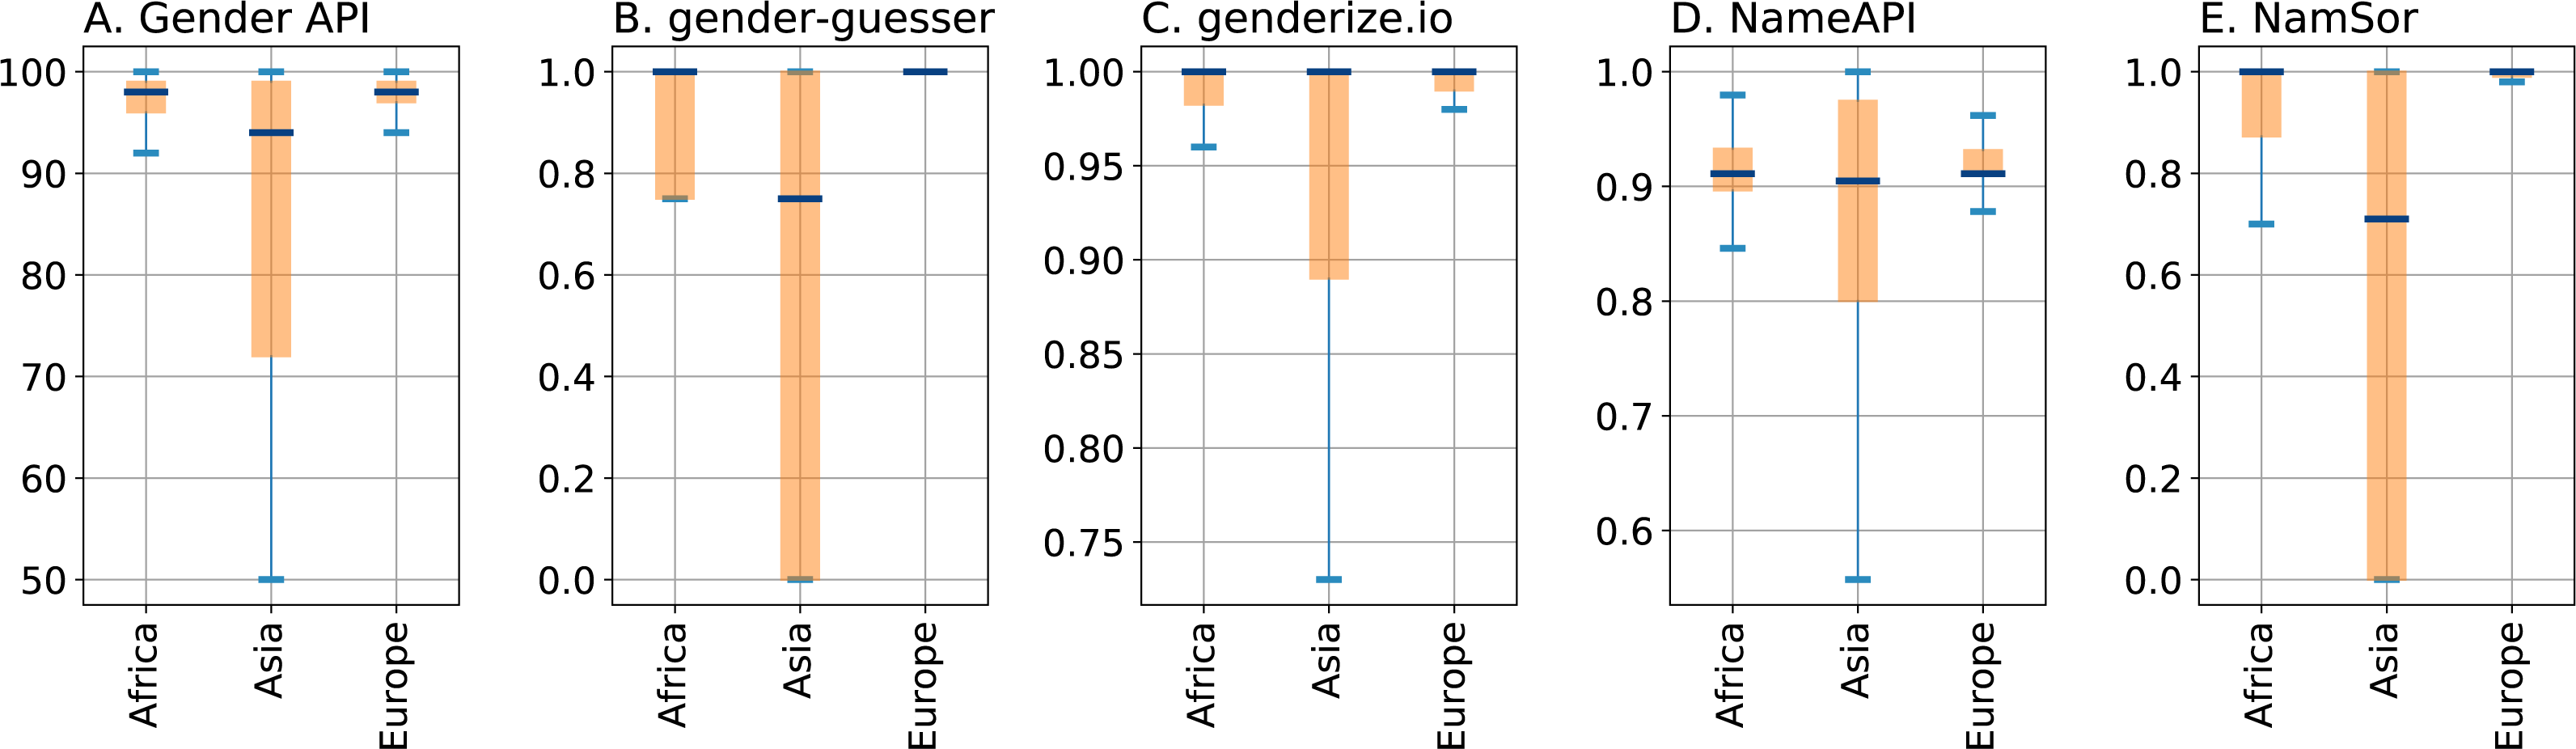
In a similar research paper, Santamaría and Mihaljević [2] compare and benchmark name-to-gender services by testing them on a dataset of 7076 manually labeled names. They also define a tuning procedure for the parameters of each method. The important findings of their work are high sensitivity towards accents (‘Jose’/‘José’) and untransparent handling of double names ('Mary-Jane'), for which most of the services use different logic when processing names with or without hyphens. Furthermore, they show how important the parameter "origin" is for all services. In the boxplot below, statistics from the quartiles of the parameters’ distributions are presented, split by the top regions predicted by NamSor�s origin API (parameters "accuracy", "confidence", "probability", and "confidence" are displayed respectively for each method). All services turn out to be highly dependent on country origin. The most confident predictions are for European origin, while those for Asian origin highly deviate from it.
Gender Recognition Through Face Using Deep LearningDhomne, Amit, Ranjit Kumar, and Vijay Bhan. Procedia Computer Science 132 (2018): 2-10. |
As for the image-to-gender methods, Dhomne et al. [3] have used the VGGNet architecture of Deep Convolution Neural Network (D-CNN) for gender recognition from visual data. They obtained a better accuracy than previous applications of such network architecture tested on the Celebrity Face dataset.
Demographic Inference and Representative Population Estimates from Multilingual Social Media DataWang, Zijian et al. “Demographic Inference and Representative Population Estimates from Multilingual Social Media Data.” The World Wide Web Conference on - WWW ’19 (2019): n. pag. Crossref. Web. |
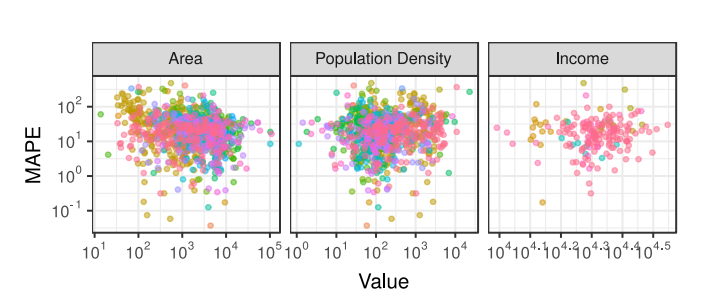
When analyzing social phenomena based on social media data, so-called 'social sensing', many researchers do not control for sampling bias, resulting in certain fallacies. Social media data is not representative, and generally, inclusion probabilities for a certain demographic group on any platform are unknown. Zijian et al. [4] address these issues by creating a deep neural architecture for joint classification of age, gender, and organization-status of social media users that operates in 32 languages (so-called "M3"). Their results show that automatic post-stratification with respect to inferred age and gender notably improves population estimation results. As an example of their model performance in debiasing, they compared the MAPE (Mean Absolute Percentage Error) of the model to three variables: the region area, population density, and average income level (figure below). Usually, there is expected to be a clear urban-rural bias in social media - it means that people from metropolitan areas are more frequent users of social platforms and provide a higher quantity of information. Moreover, income is also suggested as an explanatory variable for defining Internet users. Despite these biases, there are no significant correlations between these variables and MAPE, which means that the models do well at debiasing these differences in inclusion probabilities.
Controlling biases and diversity in diverse image-to-image translationWang, Yaxing & Gonzalez-Garcia, Abel & Weijer, Joost & Herranz, Luis. (2019). Controlling biases and diversity in diverse image-to-image translation. |
An important issue of biases in image datasets is raised in the study by Wang et al. [5]. Although their research aims to overcome this challenge in diverse image translation (DIT), it is of great relevance since machine learning mostly fits predictive models to data. The biases, in this case, refer to occasions when specifications of the training dataset result in poor generalization. These biases can be presented in different ways, such as class imbalance, capture devices, light, scale, etc. The researchers also indicate that most commercial face recognition and image captioning systems are biased towards gender and ethnicity. This is increasingly important to keep in mind also when performing gender recognition tasks.
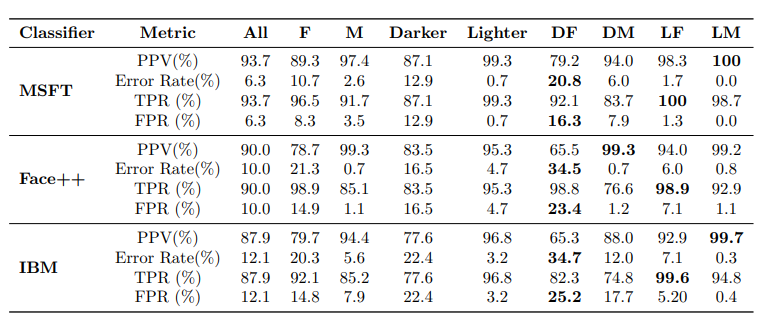
Gender shades: Intersectional accuracy disparities in commercial gender classification.Buolamwini, Joy, and Timnit Gebru. "Gender shades: Intersectional accuracy disparities in commercial gender classification." Conference on fairness, accountability and transparency. 2018. (website) |
Finally, Buolamwini and Gebru [6] present an approach to evaluate bias in automated facial analysis algorithms and datasets with respect to skin type. They compared three commercial gender classification tools (Microsoft Face API, IBM’s Watson Visual Recognition API, and Face++) by the disparities in the accuracy of classifying different subgroups. They showed that darker-skinned females are the most misclassified group (with error rates of up to 34.7%). Some of their other findings:
- All classifiers perform better on male faces than female faces (8.1% - 20.6% difference in error rate)
- All classifiers perform better on lighter faces than darker faces (11.8% - 19.2% difference in error rate)
- Microsoft and IBM classifiers perform best on lighter male faces (error rates of 0.0% and 0.3%, respectively), while Face++ performs best on darker male faces (0.7% error rate)
Additional resources
For bibliographic records, you can use the platform Ethnea -- the ethnicity predictor. However, it is possible only to use it manually, one name at a time.
There is also a CSV file with several functions for extracting names from it.
Here the authors have manually curated a list of names and gender. Refer to this publication [2].