Hotspots, weather influence and neighboring cities
A common situation on a Wednesday evening: You want to go home but still have some shopping to do or else you will be left empty handed for dinner. The town is crowded and you need to park your car way in the back of the parking area. On your way to the mall you see the typical culprit. A sport limousine driver parking right next to the indicated parking area, blocking half the road such that he only has to walk 5 meters to the mall. Now we ask ourselves: Do these people ever get fined? Where do they get fined? Are there patterns in the way they get fined?
Unfortunately, Koblenz city data is unavailable for us so we focus on the next biggest city: Cologne. Cologne is the fourth largest city in Germany and in crowded cities parking your car is always a challenge. Thus, a data set on fines in Cologne makes it the perfect match for our task. Based on this data we try to find the “parking fine hotspots”.
Additionally, we will try to answer the following questions:
-
Does the hometown of people who were fined have an influence?
-
Does weather have an influence?
Both of these question will divide the fine data into several subsets from which we want to derive further insights into the parking behavior in Cologne.
If you are interested in the technical insights of our process you can find further information in the appendix.
Which are the most fined areas?
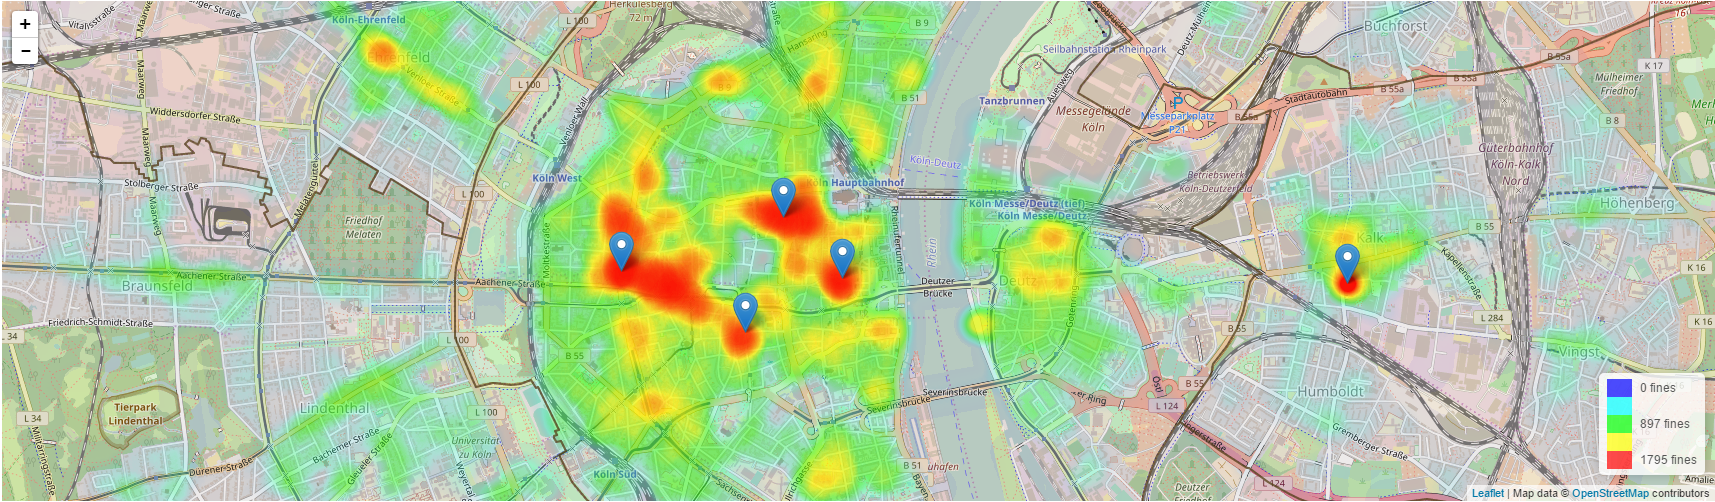
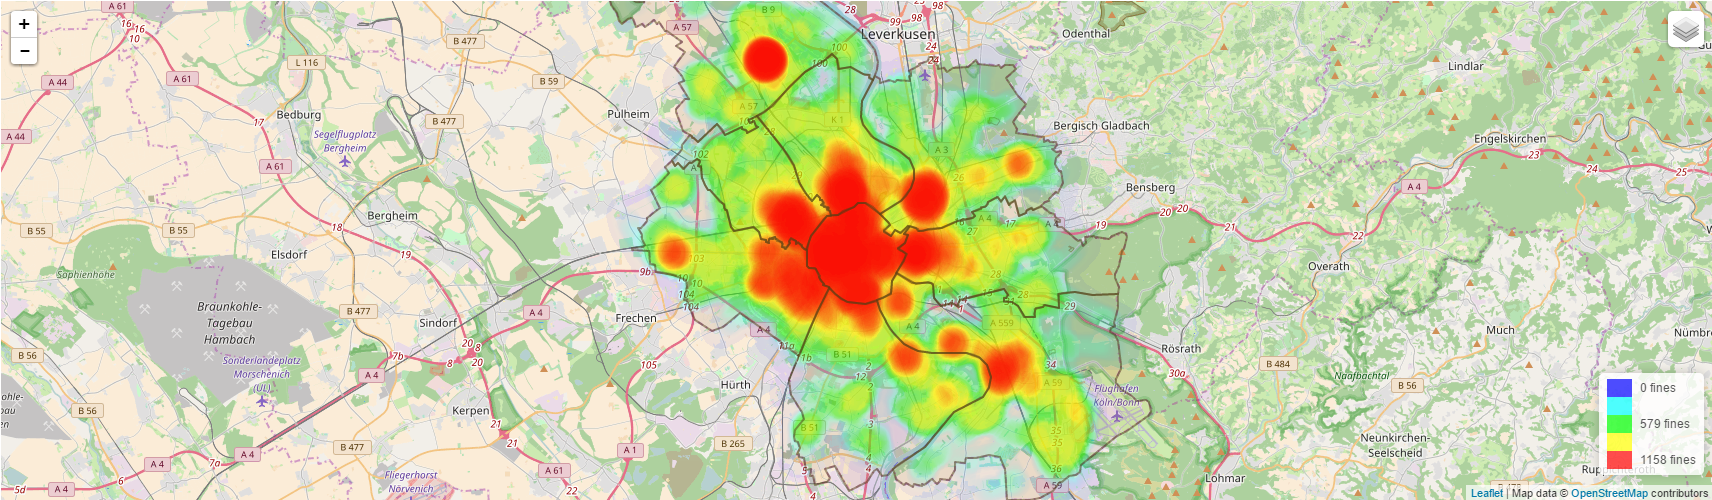
This is probably the most general but also most valuable question that we try to answer. Looking at the map displaying the total amount of fines in a spot you can clearly see that Cologne’s city center is producing the most fines. But let us focus on the outer areas first.
In the outer districts fines are always grouped around shopping areas or similar points of interests. There are rarely fines in residential areas if there are no shops. For example, there is a big hotspot around the shopping mall in Chorweiler and a frequently ticketed spot near the “Familienzentrum” in Kalk. Both overshadow the amount of fines around them.
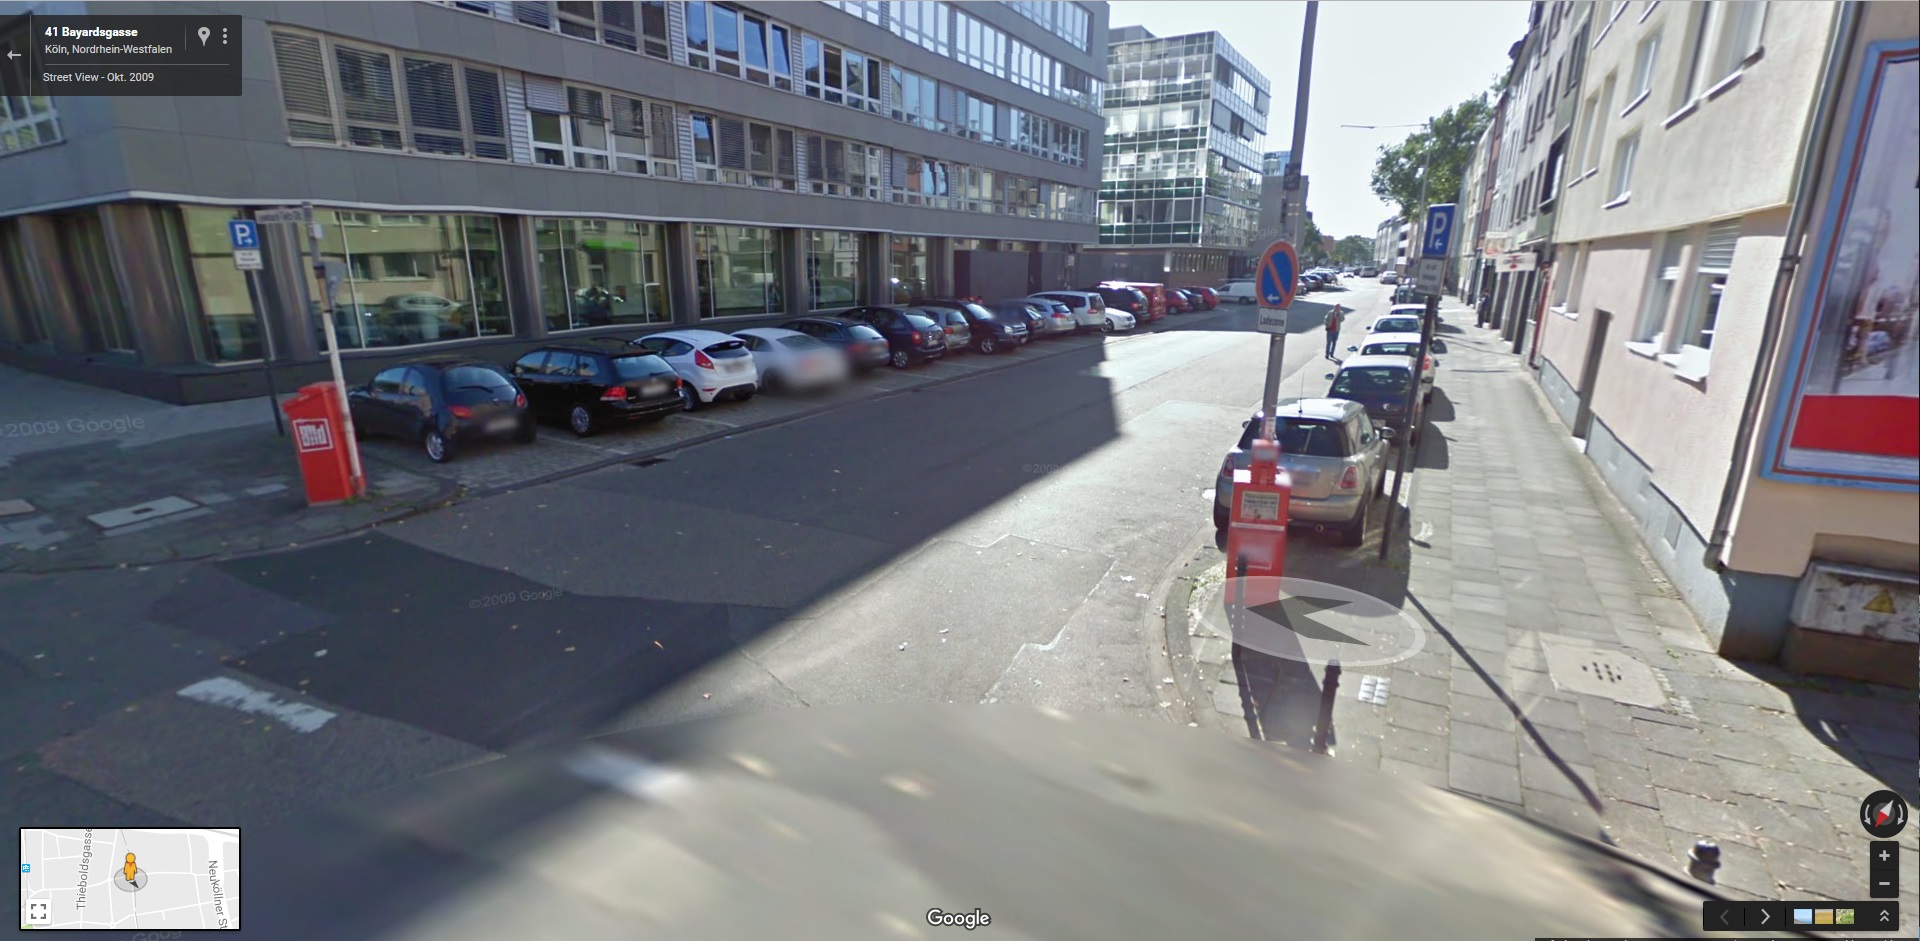
This Google Street Map snapshot shows the area. As you can see there are parking areas on both sides of the road and for all spots a parking ticket is necessary. If you check the area on the heat map there are fines along the whole street leading to the library. The fine count has its peak closest to the library and decays rapidly afterwards. This pattern is reasonable because people tend to be lazy and want to park close to their point of interest. So the fines will move towards these places as well.
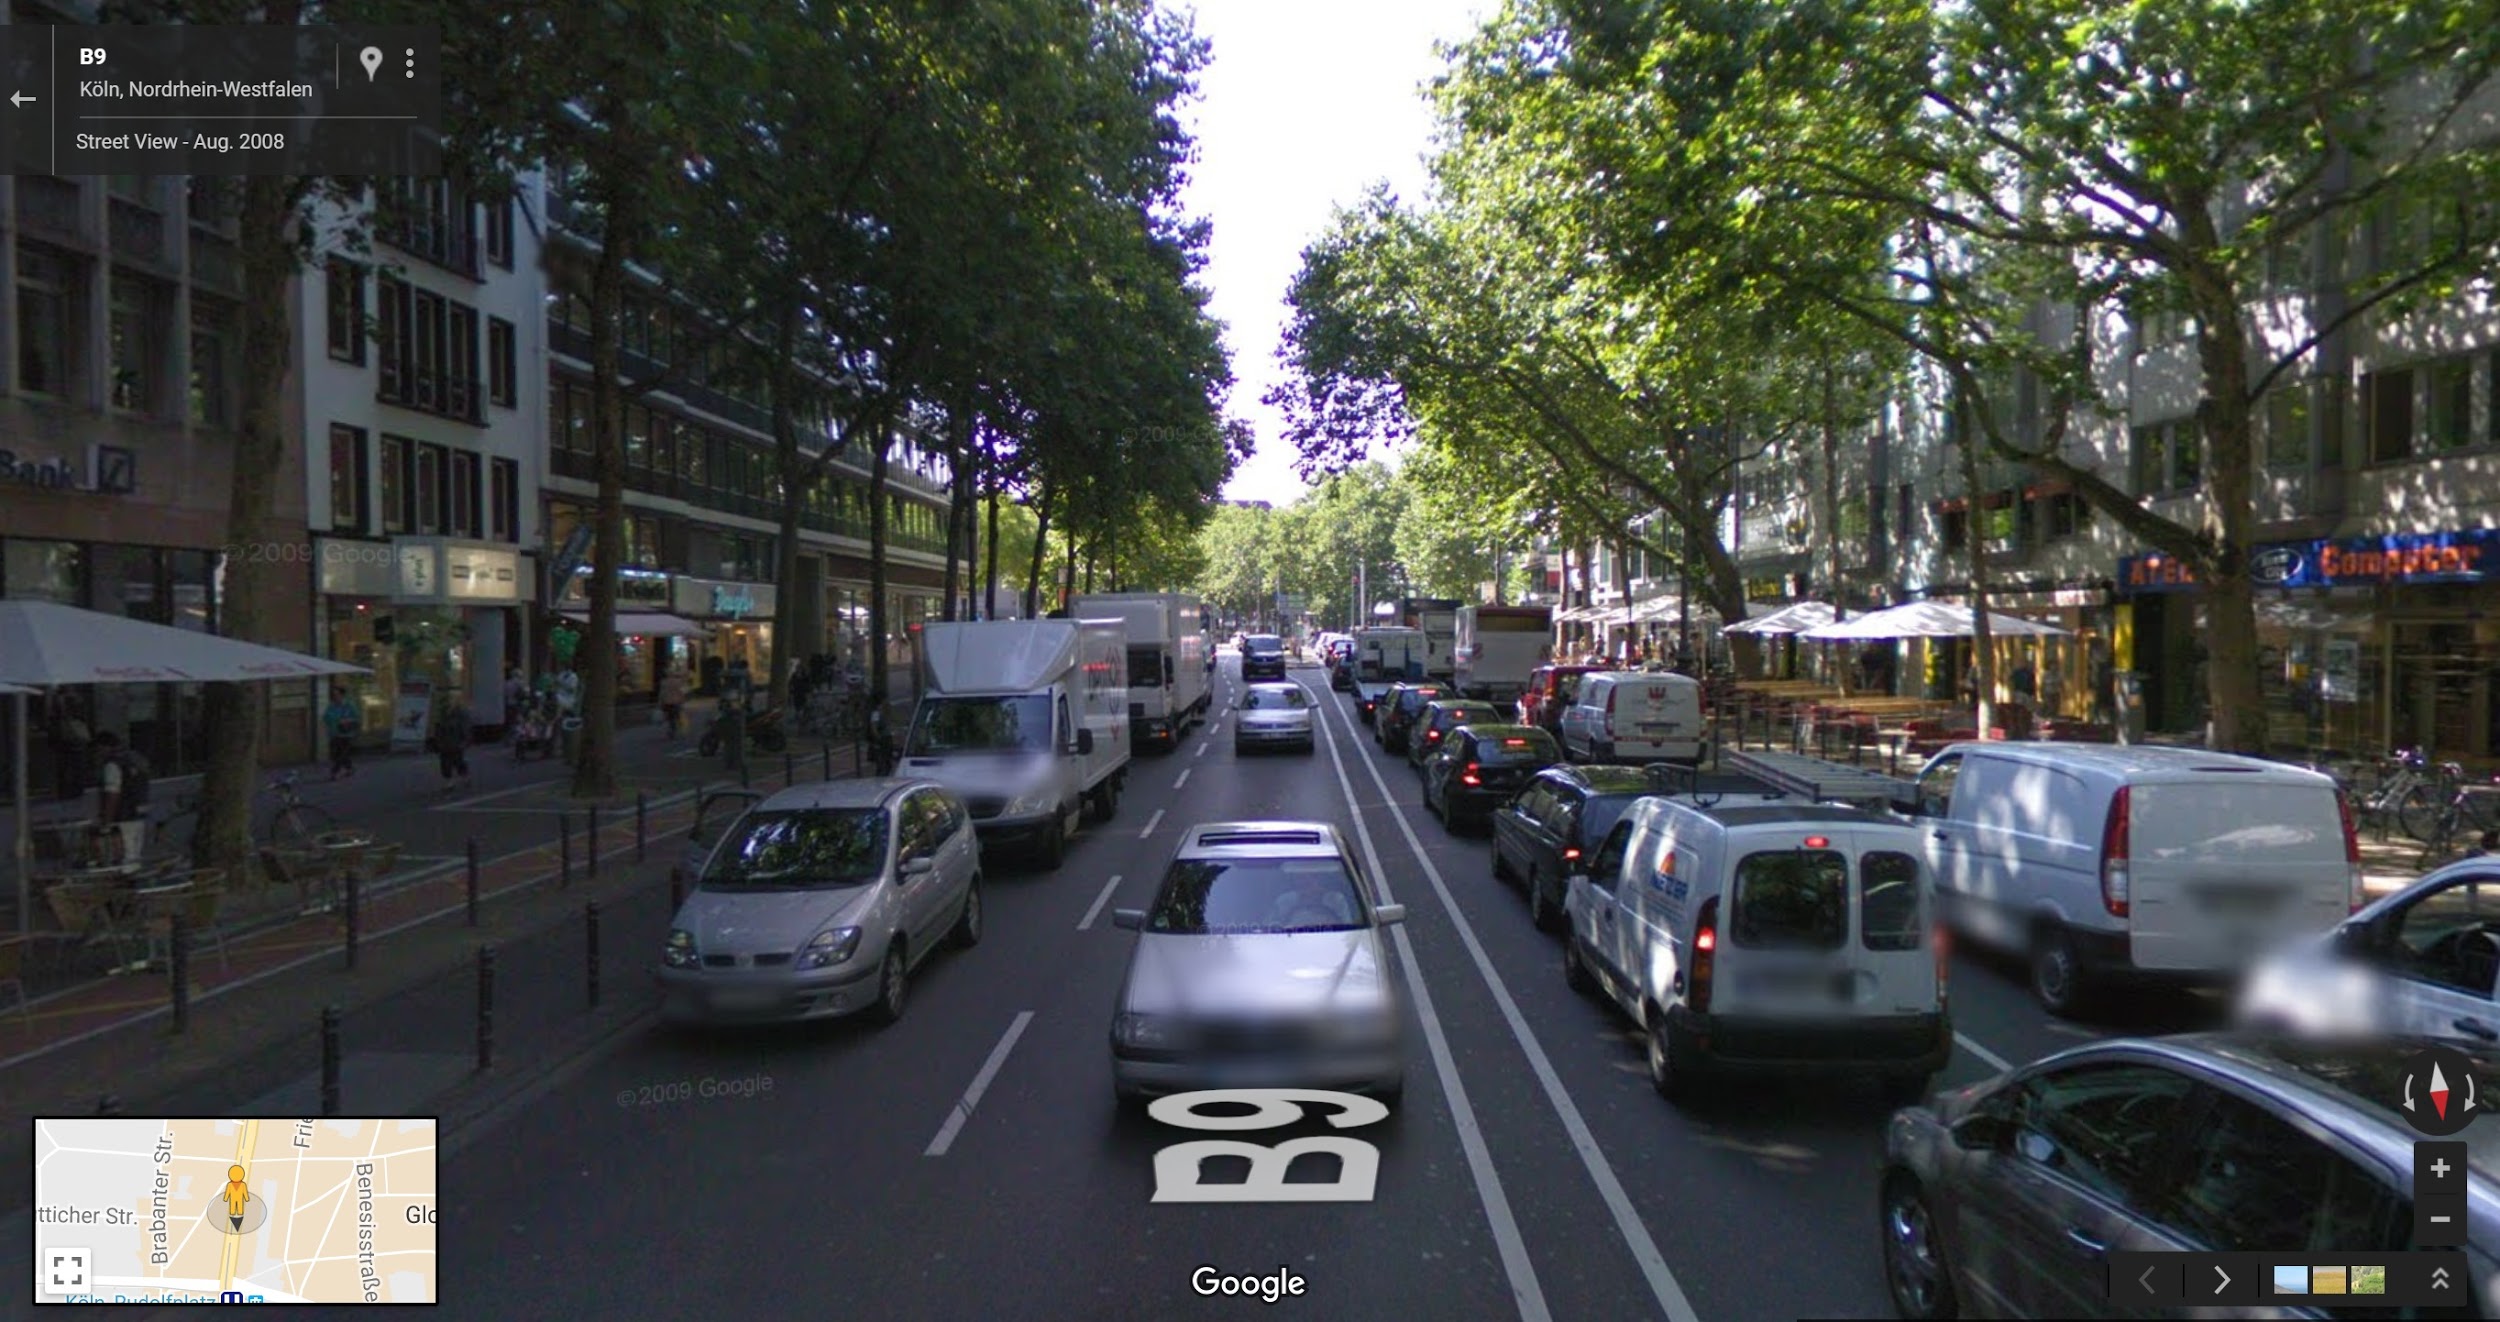
As you can see on the left side of this Google Street map snapshot they block a whole side of the road. And it is not only limited to suppliers it even attracts normal cars.
The last spot we want to focus is right next to the building of the WDR. The roads are rather tight and there are only a few designated parking spots as you can see in the following pictures:
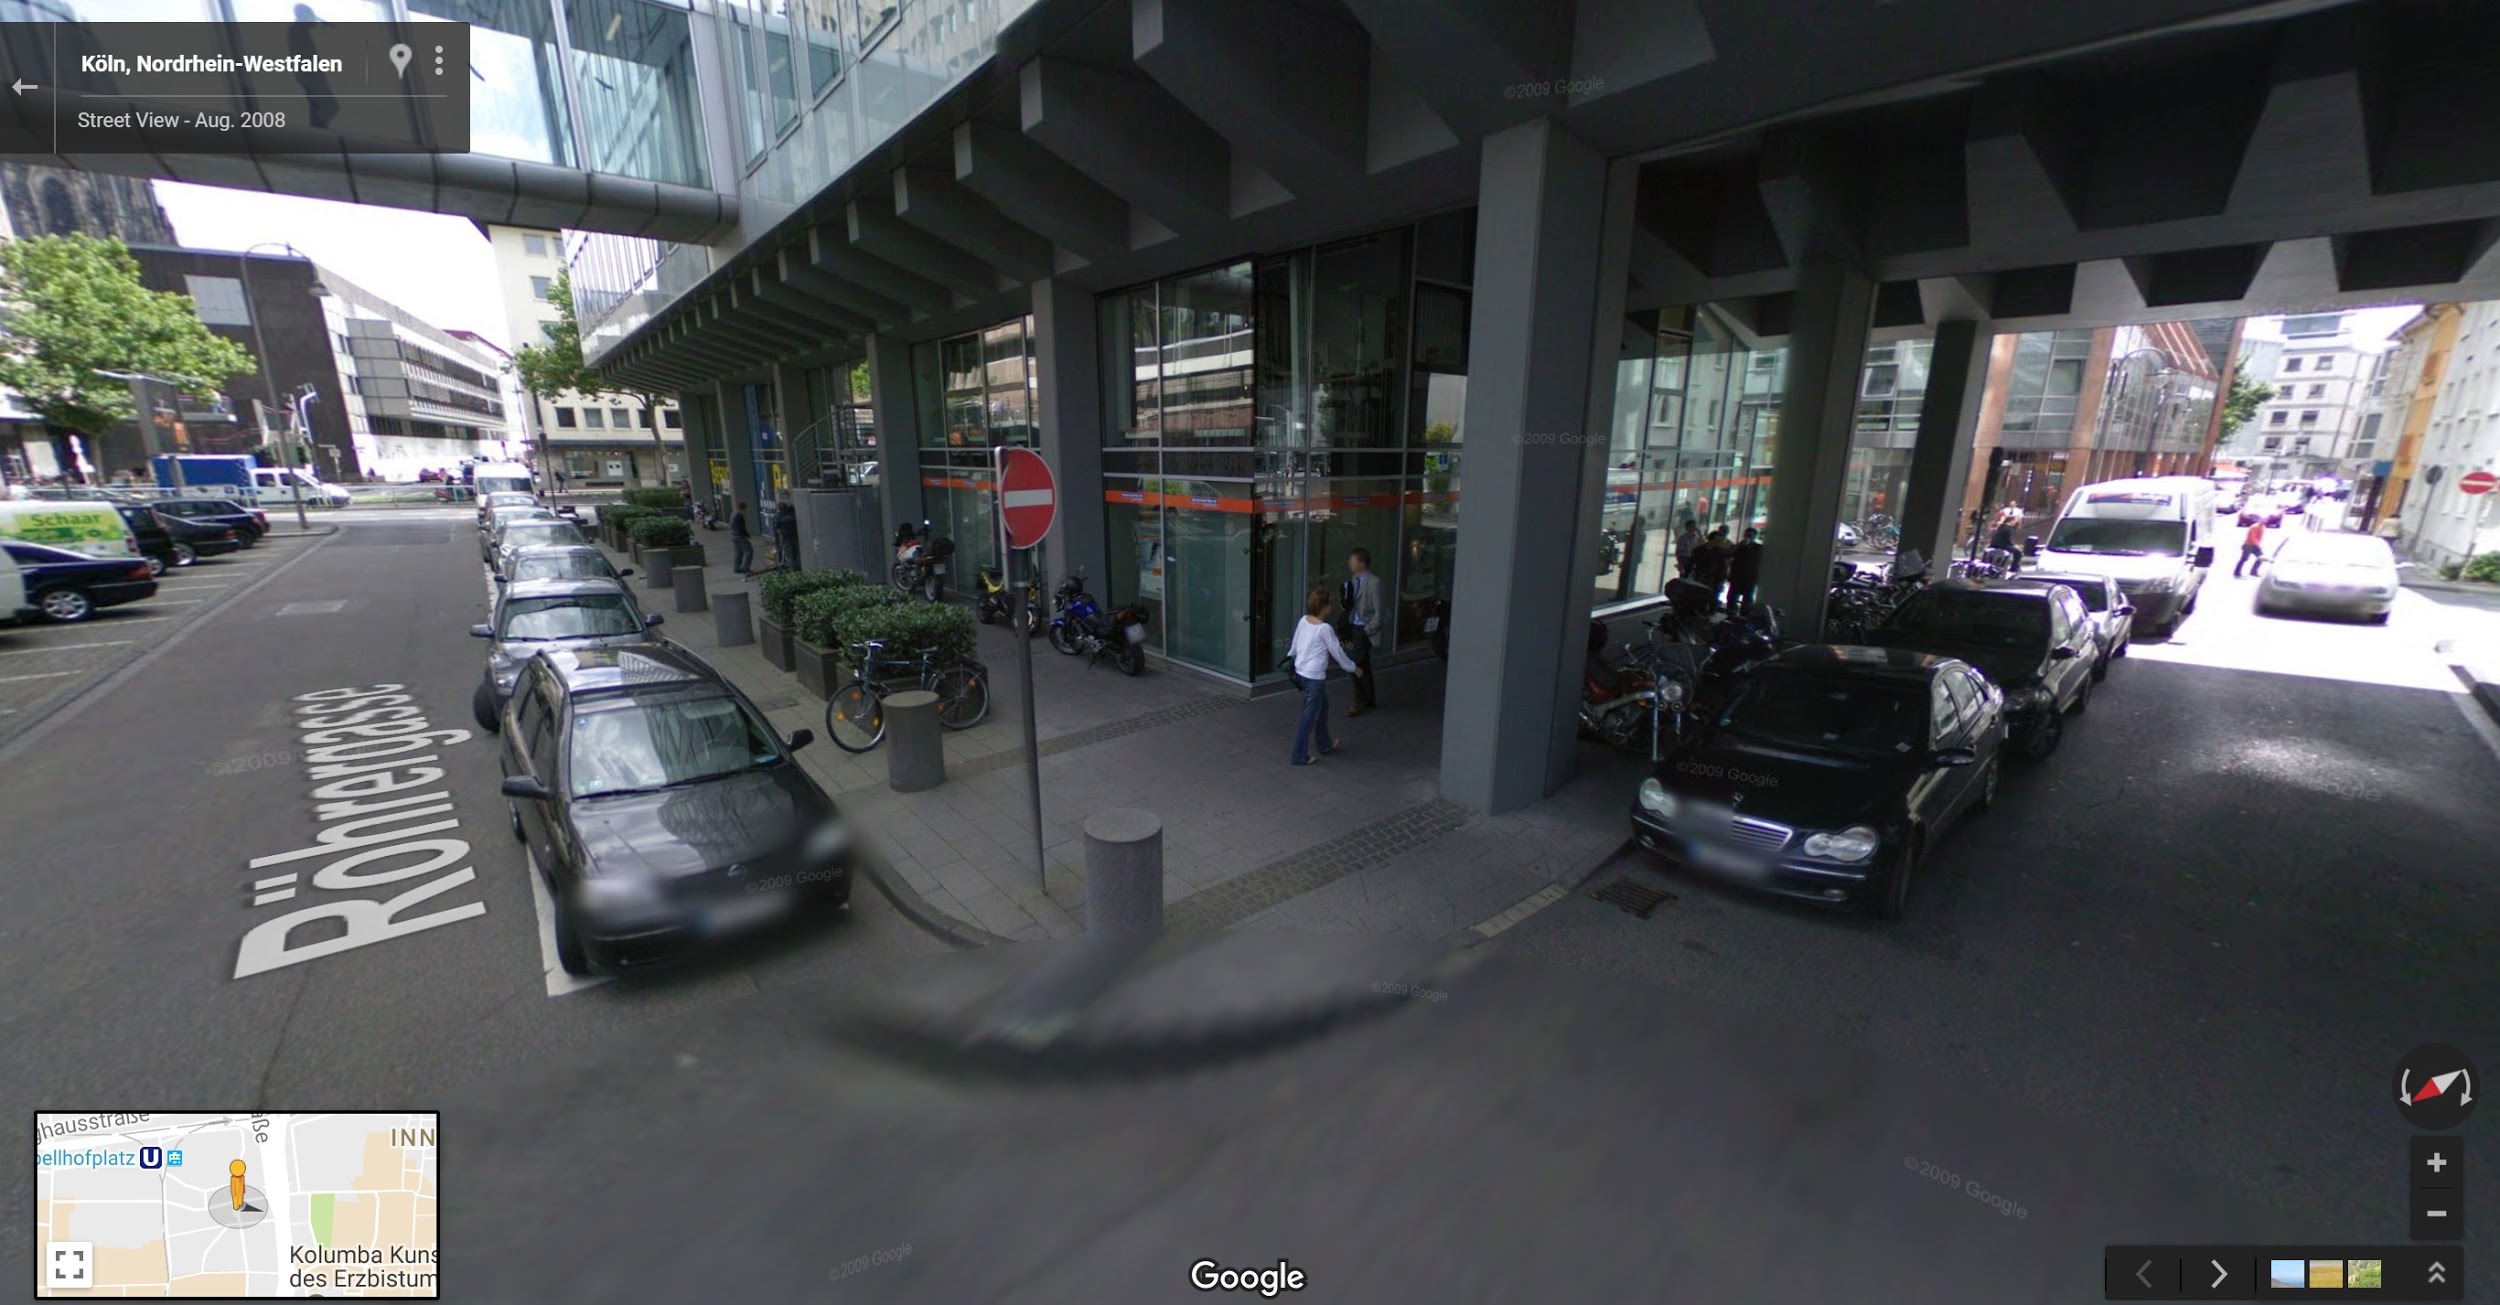
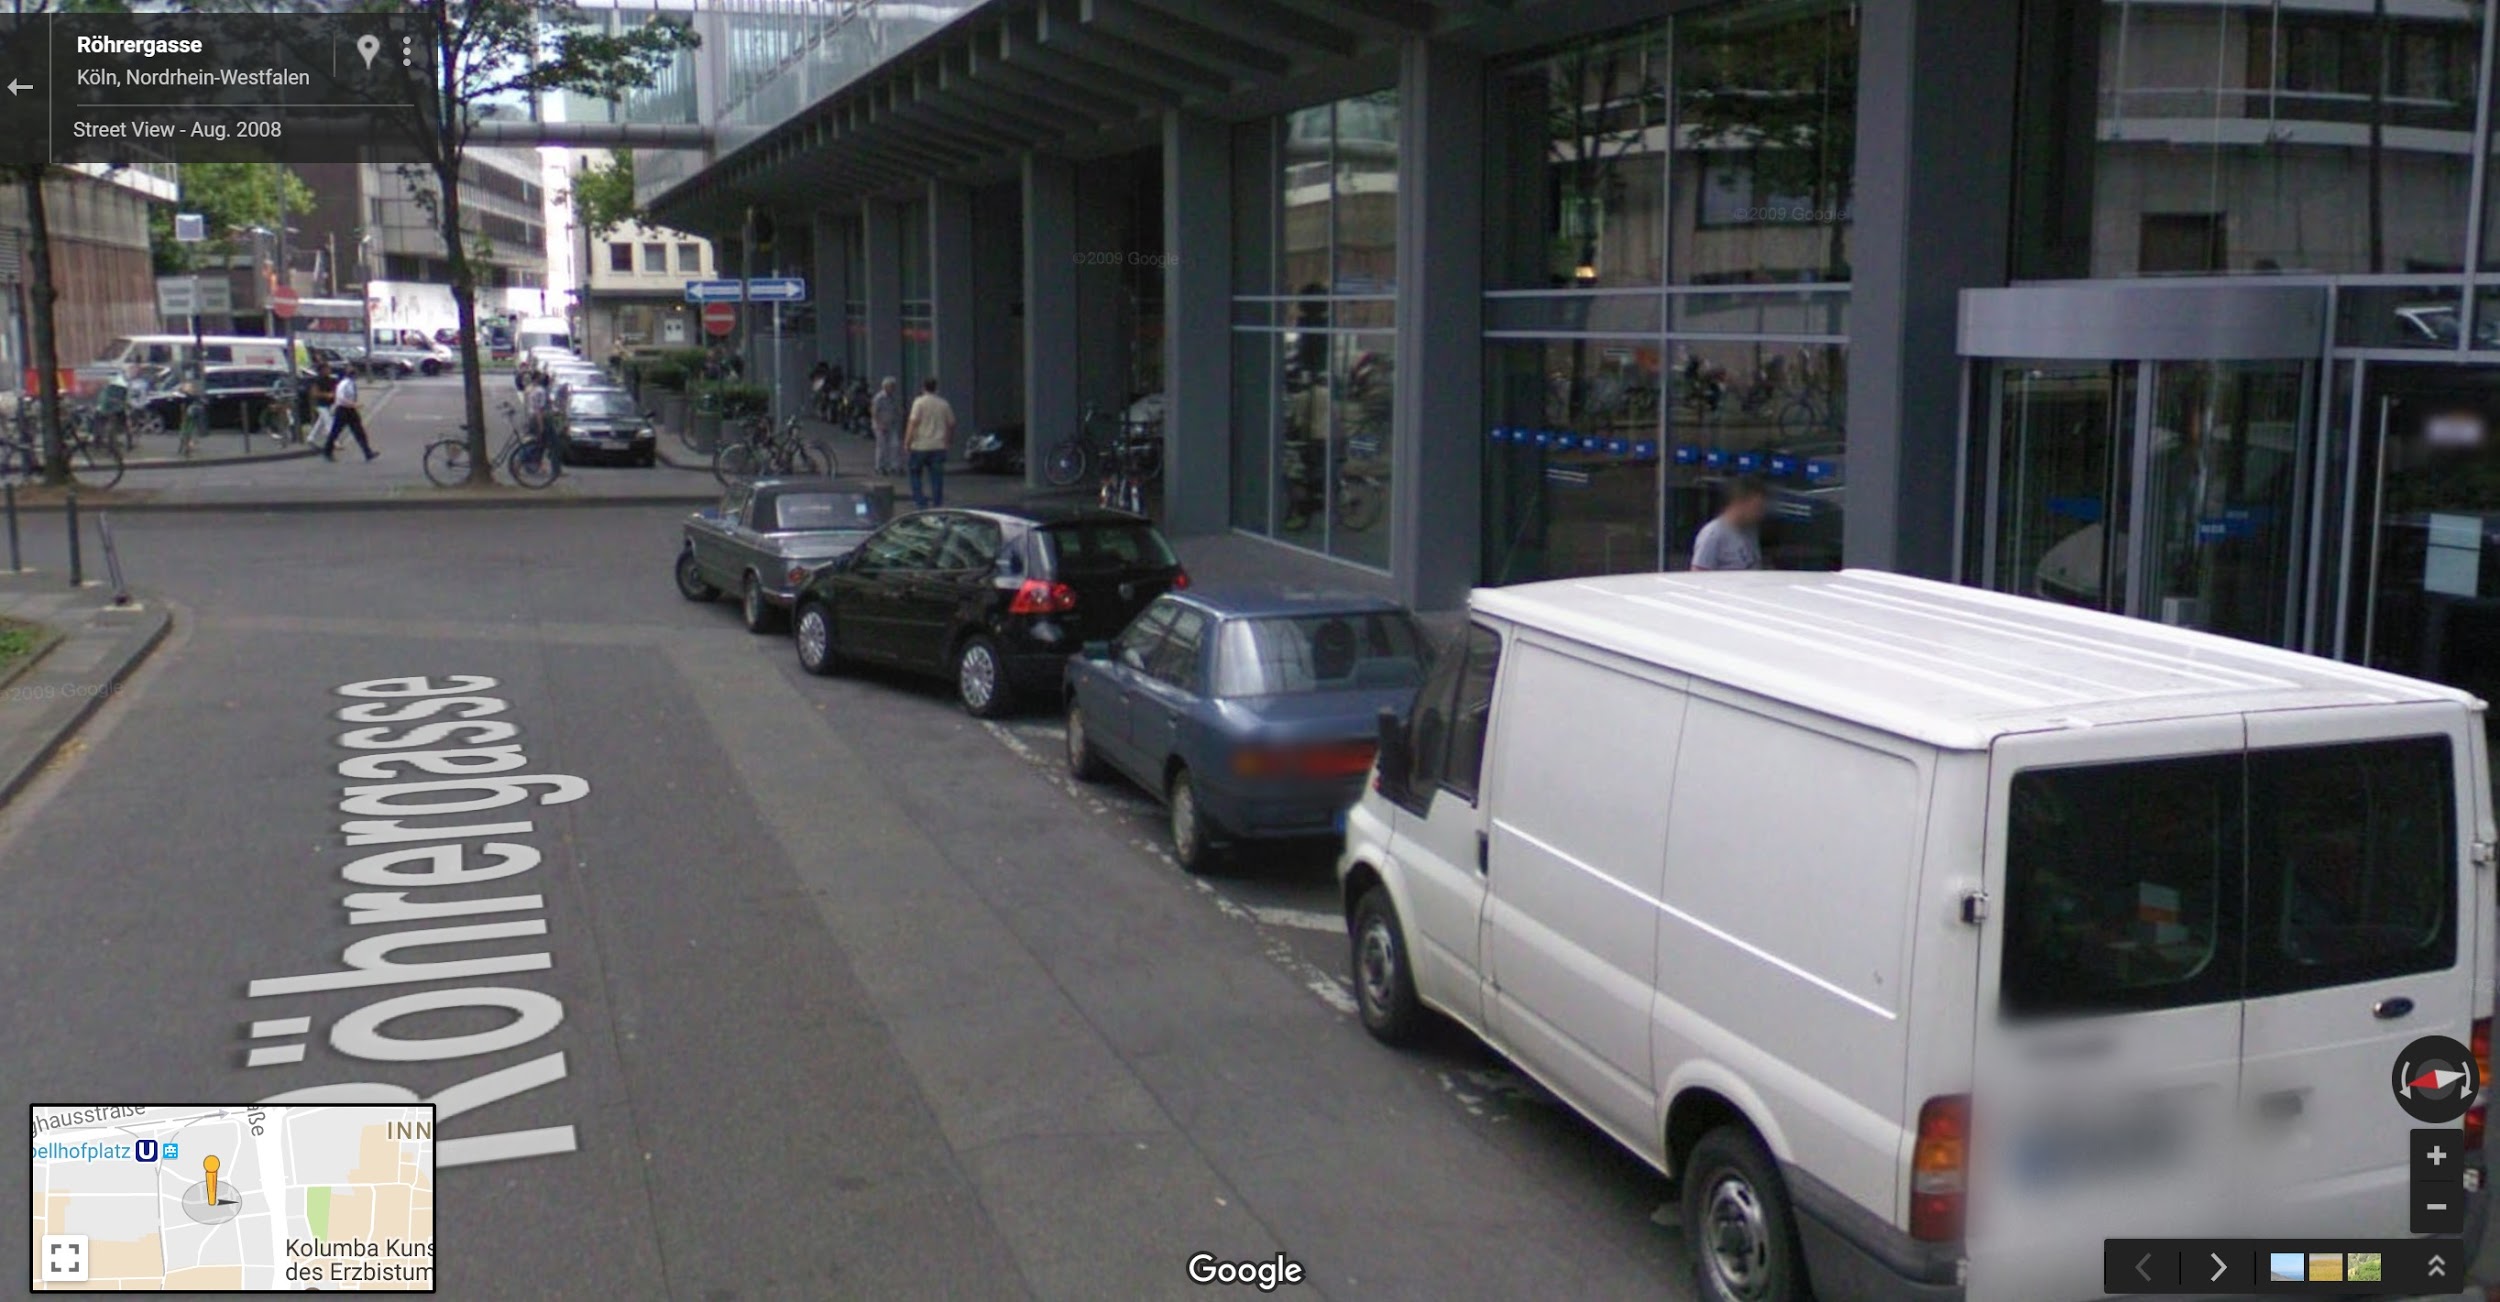
The parking areas have a time limit and need parking tickets which might be an additional factor that attracts parking fines but as depicted in the right picture there is often a lack of space. This leads to people parking improperly (cars close to the intersection) or in forbidden areas (indicated by the crossed lines below the cars).
Do the hotspots change based on the direction people are coming from?
This effect was already experienced by Ben Wellington when he examined fine data from the state of New York. He found a change in the fine hotspots based on the location people were coming from. The pattern movement was quite irregular though. We will try to reproduce this experiment on a smaller scale with the data of Cologne.
For our example we will only look for fines from people from the local proximity of Cologne. If we leave the local proximity (e.g. people from Munich) the amount of fines is rather low and are focused only on the center. The assignment to an area is bound to the number plate of the fined car.
If you cycle through the different maps you will see that the center will always remain at a similar amount of heat but the outliers change. The people of Cologne will be our reference for places where hotspots appear. If you cycle through the maps, you can see that the outliers move in the direction of the city their car is registered in. Cars from Bergheim tend to get fined in the western part, cars from Berg. Gladbach collect their fines in the eastern part of the city. The pattern repeats for Neuss and Siegburg. Only cars from Bonn and Leverkusen differ.
The amount of fines for Leverkusen in the north is not as pronounced as expected and the central peaks are shifted to the north-east. A possible reason for this could be the highway A3. It is a major highway that connects Leverkusen and Cologne so a shift towards its direction is quite reasonable.
The fines of cars from Bonn produce a different pattern compared to all others but looking at the major highway connections might explain these transpositions as well.
Does weather influence the fine hotspots?
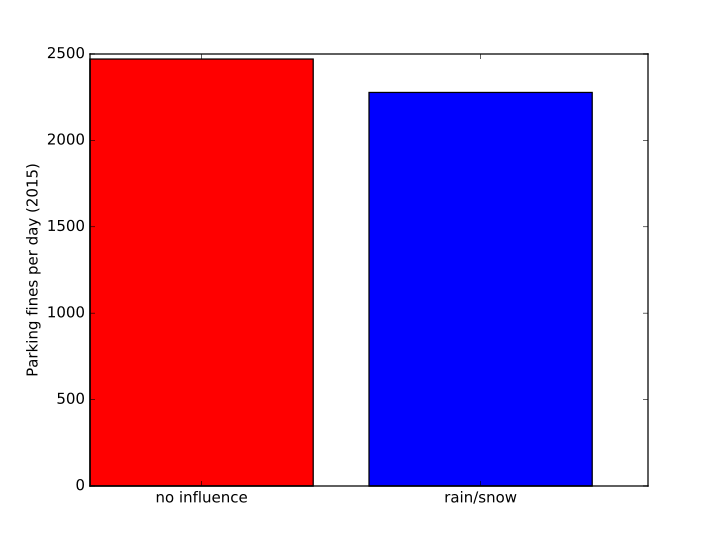 We were pretty uncertain how weather would influence the fine behavior. We assumed that rain or snow will lead to people using more cars and parking closer to their point of interest which will ultimately lead to more fines. To account for the different amount of rainy and non-rainy days we changed our scale from the total amount of fines in 2015 to a scale if total amount of fines per day. But as you can see in the the bar chart there are more fines on days without rain or snow. Which is quite surprising. The margin is not significant enough to make a generalization though. Additionally, there are some factors like the behavior and amount of people issuing the tickets that we cannot adjust for.
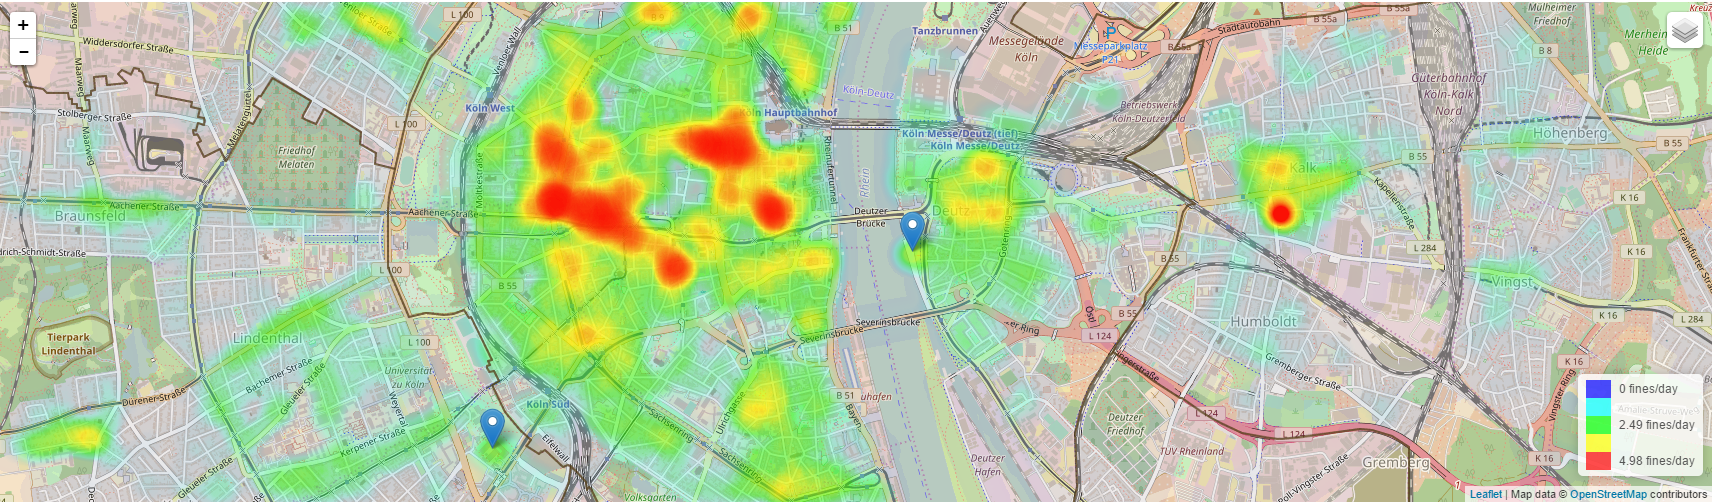
So we went to put the fines on a map to see if there are anomalies. As you can see on the heat map the weather does not have a major influence on the parking behavior in general. But we found two exceptions. The University of Cologne and the “Deutzer Werft”.
Regarding the university, we can experience a similar behavior in our own university. If the weather is bad there are usually less people attending lectures, thus there are more open parking spots. If the weather is good a lot of people are roaming around and the parking area is crowded. Which ultimately leads to more people parking in awkward positions and getting fined.
The same behavior shows for the “Deutzer Werft”. We even found an article describing this behavior in a local newspaper of Cologne. You can find it in the appendix. As soon as the weather is nice the “Deutzer Werft” transforms into a huge parking area even though parking is prohibited. The area is favored by pedestrians and amateur athletes and is used for several events so the use as parking area is not intended.
What can we conclude?
We could see that parking a car in the central city of Cologne is no fun. There will always be a rather high chance of running into poorly parked vehicles. The fines are often placed around crowded shopping areas (ex. Chorweiler, Quatermarkt). So our initial “evening shopping culprit” will actually get a fine from time to time which is at least some statistical relief. But there are also other points of interest (ex. WDR) that produce a lot of fines. This is mainly due to a bad and confusing parking situation. So it is not always the actual bad intention of certain people.
Sometimes it is in fact a matter of laziness though. As seen in the number plate example people from the neighboring cities tend to get fined close to their home area. Which leads to some increased fine counts in the outer areas of Cologne.
The weather does barely influence the fines (despite us having different expectations). There are some interesting exceptions though namely the university and “Deutzer Werft”. Which you should only visit on rainy days if you are easily offended by people parking in weird places.
Appendix
Technical process
To find the answer to our key questions we used a dataset about the all fines in Cologne of 2015. The dataset contains information about the type of fine, the time, car type and origin location (number plate) and the address. So we could filter all fines that were related to parking. But due to the lack of actual GPS coordinates we needed to lookup the addresses by ourselves. To achieve that, we used the Overpass API to access OpenStreetMap data of Cologne. OpenStreetMap provides an open, editable map of the world so it was perfectly suitable for an address lookup. We matched the whole addresses if possible else we tried to match the nodes of the whole street (distances of the street nodes have been normalized).
After attaching the data to their coordinates we used Leaflet and heatmap.js to build the interactive visualization.
Links
Inspiration (Tumblr articles – Ben Wellington)
http://iquantny.tumblr.com/post/144197004989/the-nypd-was-systematically-ticketing-legally
http://iquantny.tumblr.com/post/84393789169/californians-love-brooklyn-new-jerseyans-love
Deutzer Werft – Fine article
Fine data of Cologne (2015)
https://offenedaten-koeln.de/dataset/bu%C3%9Fgelddaten-koeln-2015
Overpass API
http://wiki.openstreetmap.org/wiki/Overpass_API
OpenStreetMap
Leaflet
heatmap.js
https://www.patrick-wied.at/static/heatmapjs/de/
Unused plots
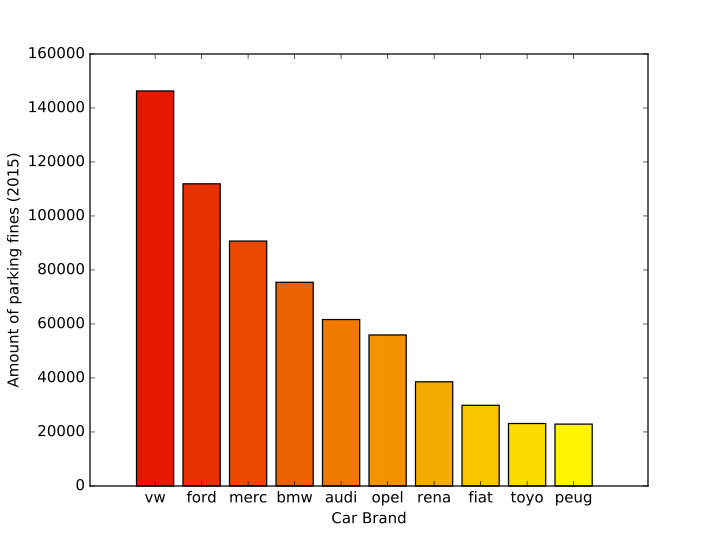
Plot (Top 10: most fined car brands)
NOTE: Raw counts, couldn’t normalize for total car sales obviously
Additional heat map on this topic on the webpage.
Be First to Comment